Grand Rapids’ Snowiest Months, Ranked — and What They Mean for Your Roof
Grand Rapids’ snowiest months, ranked by NOAA’s 30-year climate normals, are January (22.6 inches), December (20.8 inches), and February (17.2 inches), in that order. Grand Rapids Roofing Pros is an independent dispatch service connecting West Michigan homeowners with licensed local roofers once dam damage shows up.
Call now for a licensed local roofer
Call now and we’ll connect you by phone with the licensed local roofer you’re matched with — no phone tag, no obligation.
Ready to talk to someone about your roof?
Call to reach the licensed local roofer you’re matched with in Grand Rapids & West Michigan.
Call (901) 704-8932When you call, stay on the line for a few seconds while we match you with the licensed local roofer for your area. Have your address and a quick description of the problem ready.
We connect homeowners with independent licensed roofing professionals in the Grand Rapids area. We are not a licensed contractor and do not perform roofing work ourselves.
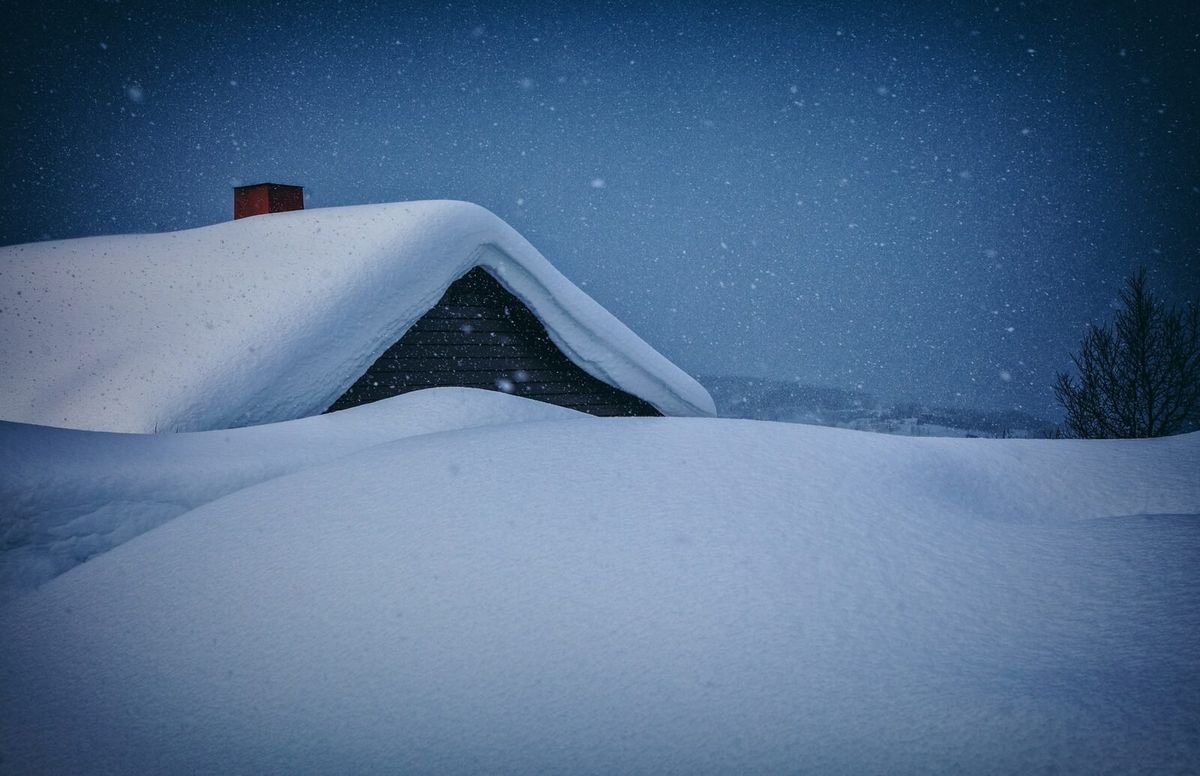
Quick answer: what are Grand Rapids’ snowiest months?
By NOAA’s 1991–2020 climate normals, Grand Rapids’ three snowiest months are January (22.6 inches), December (20.8 inches), and February (17.2 inches), together about 60 inches of the metro’s 77.6-inch annual average. For roof risk, the more useful number is standing-cover days: Grand Rapids averages 28.7 days a year with 5 inches or more of snow on the ground, almost all within this same three-month stretch. Grand Rapids Roofing Pros times inspection dispatches to that window.
Why doesn’t the snowiest month always mean the highest-risk week?
A monthly-total ranking treats each inch of snow the same whether it melts off in two days or sits on the roof for two weeks. Roof risk works differently: an ice dam needs a standing pack that stays put while attic heat works on it from below, night after night. That’s why Grand Rapids’ 28.7 average days a year with 5″+ of snow on the ground, and 8.3 days with a foot or more — concentrated in January and February — is arguably a more useful number than any single month’s total.
For the full mechanism behind how standing snow becomes an ice dam, see how ice dams form on Grand Rapids roofs. For a complete month-by-month risk breakdown across the whole year, see our companion Grand Rapids snowfall and roof risk calendar.
Three things the simple ranking doesn’t tell you
A snowiest-months list is a useful starting point. Here’s what it leaves out.
Total inches vs. days on the ground
January’s 22.6 inches ranks it #1, but the metro’s 28.7 annual days of 5″+ standing cover — spread across January and February together — is the number that actually drives ice-dam duration.
Why January’s ranking understates its risk
January is both the snowiest and among the coldest months, so its pack persists longer than a warmer month with similar totals would. Rank and risk usually agree here, but not automatically.
The same three months, more snow than a generation ago
Grand Rapids’ seasonal average has risen from roughly 70.9″ to 76.9″ over the past three decades — see our full calendar for the trend in more depth.
Grand Rapids’ snowiest months, by the data
The single snowiest month of the year and the deepest point of the standing pack.
Where the standing snowpack begins in earnest, setting up January’s peak.
Still deep in the standing-pack window even as the monthly total drops.
The standing-cover metric that matters more than any single month’s ranking.
Sources: Current Results — Grand Rapids snowfall and snow-depth data (NOAA/NCEI Climate Normals, GRR).
How to use this ranking as a homeowner
Expect risk to start in December
Don’t wait for January’s peak — the standing pack that feeds ice dams typically begins building the month before.
Watch standing cover, not fresh snow
A light dusting that melts in a day matters less than a pack that survives a week or more on the roof.
Know the trend isn’t shrinking
Grand Rapids’ mid-winter snowfall has trended up, not down, over the past generation — this window isn’t getting easier to skip.
See the full calendar
For risk guidance across every month of the year, not just the top three, see our month-by-month roof risk calendar.
Questions Grand Rapids homeowners ask
What is Grand Rapids’ single snowiest month?+
January, averaging 22.6 inches of snowfall per NOAA’s 1991–2020 climate normals for Gerald R. Ford International Airport, the highest of any month.
Is the snowiest month also the highest ice-dam-risk month?+
Mostly, yes, but persistence matters more than the peak. January ranks first by total snowfall and also sits inside the metro’s longest standing-snow-cover stretch, so rank and risk line up here, though that isn’t automatic for every month.
Is Grand Rapids getting snowier or less snowy over time?+
Grand Rapids’ seasonal snowfall average has risen from about 70.9 inches (1961–1990) to 76.9 inches (1991–2020). See our full month-by-month calendar for a deeper look at that trend.
How is this different from your month-by-month roof risk calendar?+
This page ranks and explains the top three snowiest months and why total inches can be a misleading risk signal. Our companion calendar covers every month October through September with a specific risk note for each — the two are meant to be read together.
Ice dam help across Grand Rapids & Kent County
We connect homeowners with licensed roofers throughout the Grand Rapids metro and surrounding West Michigan communities.
Continue the seasonal series
Get matched with a licensed Grand Rapids roofer
Call now and we’ll connect you with a licensed West Michigan roofer for ice dam removal and an attic-side diagnosis. No phone tag, no obligation.
Call now for a roofer
Independent dispatch service connecting homeowners with licensed local roofing professionals. We are not a roofing contractor.